
1
A significant share of the world population still lives in difficult and in some cases deteriorating development conditions.

Over the past three decades, the world has transformed. People’s aspirations have changed and so have their development challenges. The global geopolitical landscape has shifted, broadening endorsement of collective approaches such as the Millennium Development Goals and the Sustainable Development Goals (SDGs). Deepening and emerging challenges have spurred us to write this report as a contribution to ongoing global dialogue on development progress beyond gross domestic product (GDP). It also provides a tool for countries to re-evaluate development outcomes and pursue constructive regional and national discussion on related policies. The report proposes a new global Development Challenges Index (DCI) that measures shortfalls in desirable achievements in three areas: the quality of basic human development, environmental sustainability and good governance. One of the main findings is that governance is one of the world’s most pressing development challenges. The only challenge on the rise globally, it contributes most to a poor showing on the DCI. This is largely due to increased shortfalls in democratic governance over the past two decades, not so much because of gaps in effective governance. Another core insight centres on the significant share of the world’s population living in difficult conditions with serious development challenges. Only 15 countries have a very low level of challenges; 49 countries face high and 25 countries very high challenges. Globally, serious deprivations in the quality of human development remain. No region has a very low score on qualityadjusted human development challenges. Much must still be achieved, even in the two most developed regions of the world, Europe and North America. Education challenges comprises the most significant share of quality-adjusted human development challenges in most regions, followed by income challenges. Environmental sustainability remains a major global concern even as regions have shown little sign of progress. The burden of increased climate change and energy intensity is higher for North America, and to a lesser extent for Europe and Central Asia, while the burden of poor environmental health is the main concern for developing regions. As the ultimate aim of this report is to trigger policy debate, we hope it will lead to follow-up dialogues to address fundamental challenges at the global, regional and, most importantly, national levels.
Rola Dashti, Executive Secretary UNESCWA
Strengthen environmental and health systems to improve healthy life outcomes.
Build knowledge-based economies with integrated education and labour market systems.
Forge strong links between government effectiveness and democratic governance.
Prioritize the most challenged countries and ensure human security in conflictstricken countries.
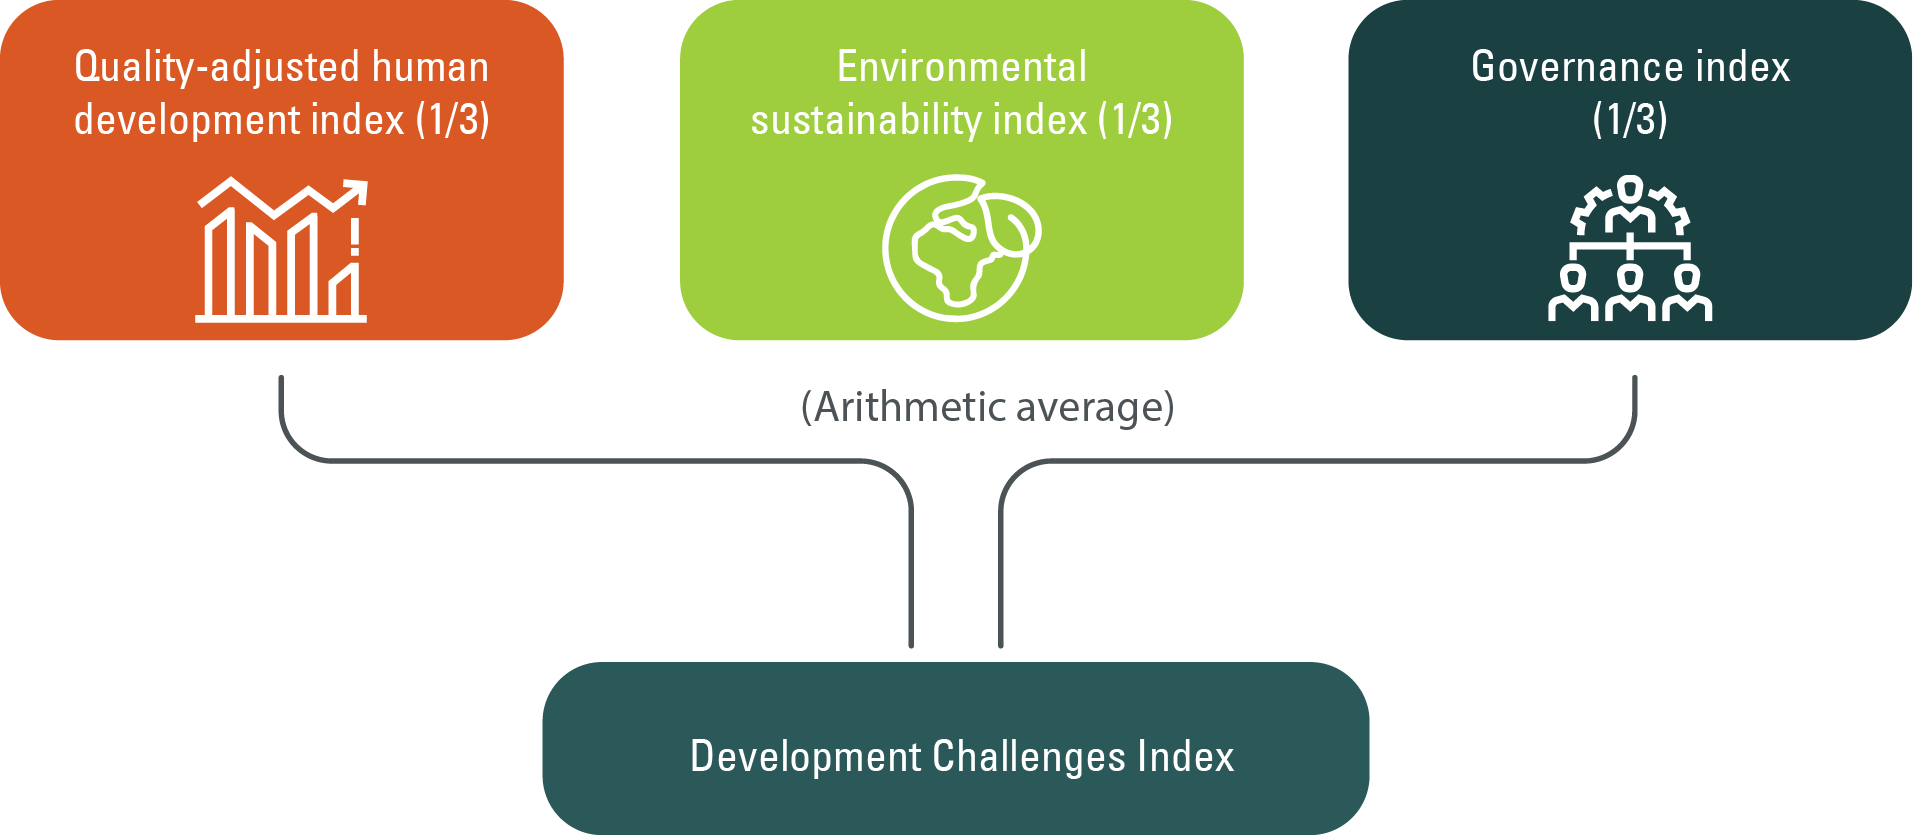
The proposed DCI measures shortfalls in three development achievements: basic wellbeing freedoms as measured by the three quality-adjusted dimensions of the traditional HDI; environmental sustainability and good governance. In line with the report’s conceptual framework, each of the challenges and their dimensions are awarded an equal weight. To maintain simplicity, the report authors used an arithmetic average rather than a geometric one, given good reasons for doing so when many indicators are involved. This also leads to an index that is easy to compute and interpret.
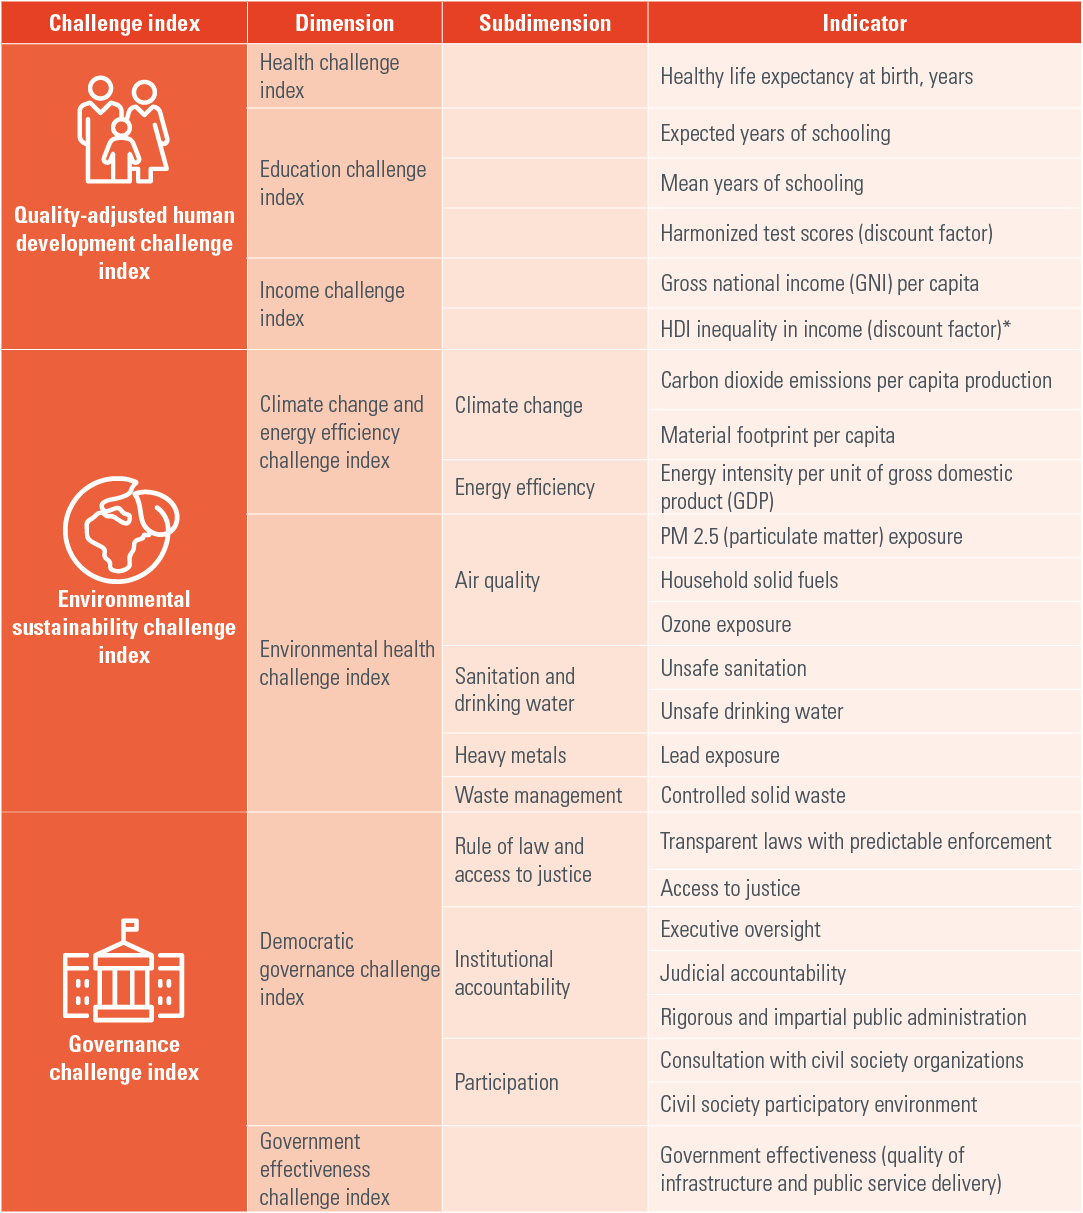
Constructing the DCI involves two simple steps. The first entails a conversion from achievement indicators to challenge indicators by subtracting the former from 1. The second step is to take the simple average of the indices reflecting the challenges (figure 1).
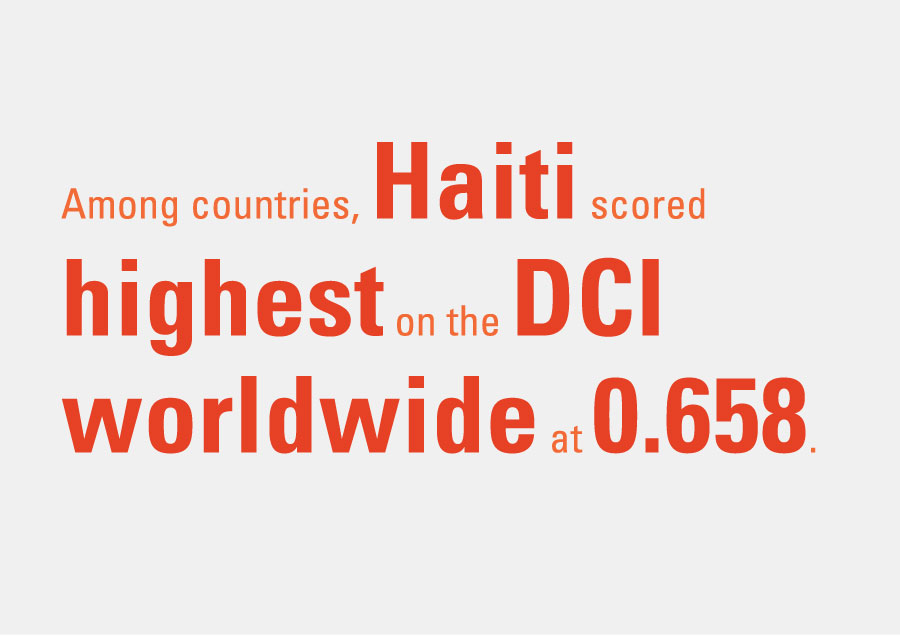
DCI reductions have occurred globally, from an average of 0.485 to 0.437, and across most regions. East Asia and the Pacific achieved the greatest reduction (figure 2). Sub-Saharan Africa is the most challenged region with an average DCI score of 0.553 in 2020; North America, with a score of 0.249, is the least challenged region. The Arab region and South Asia are highly challenged, lying well above the world average. They show conspicuous gaps in DCI levels compared to Latin America and the Caribbean and East Asia and the Pacific.
The graduation of East Asia and the Pacific from the high- to the medium-challenge group has led to a significant drop in the share of the world population living with significant challenges, from 60 per cent in 2000 to 36 per cent in 2020. There has been little movement in the very high- to highchallenge group, however (figure 3).
Nearly all 20 of the highest-performing countries on the
HDI are in the least-challenged group of the DCI, with
very high rank and score correlation. For the Nordic
and most Northern European countries, the DCI will
not make much difference. For medium and low HDI
country groups, differences in scores and ranks are
significant.
Although the SDGI’s overall correlation with the DCI
is quite strong, the relationship diverges from the HDI
(figure 4). This is not surprising since the SDGI includes
more diverse dimensions and indicators to measure
progress on the 17 SDGs.
The quality-adjusted human development challenge index measures shortfalls in achievements in healthy lives, quality education and equally distributed income. No region has a very low quality-adjusted human development challenge index, which means there is still much to be achieved even in the world’s most developed regions, North America and Europe and Central Asia. Sub-Saharan Africa faces very high challenges, followed by South Asia and the Arab region, which scored high and medium, respectively.
As the most challenged region over the past two decades, Sub-Saharan Africa faces deprivations resulting from many factors, including poor governance performance, civil war and shocks such as the AIDS pandemic. Another region with high qualityadjusted human development challenges is South Asia although it also saw the greatest decline in these challenges from 2000-2020 (figure 5).
Three indicators particularly influence the quality-adjusted human development challenge index: the pupil-teacher ratio, the number of doctors and number of hospital beds per 1,000 individuals, and knowledge use in the economy, often captured by economic diversification and complexity indices.26 Countries striving to improve these variables generally show the best outcomes on the index.
There are high negative correlations between the healthy
life expectancy challenge index and the capacity of the
health system index, based on the simple average of the two
indicators of the number of doctors and number of hospital
beds per 1,000 individuals (figure 6).
Poor health and educational outcomes in many countries
are a logical result of insufficient institutional capacities,
such as a lack of nearby hospitals, doctors or teachers.
Employment is vital to quality human development
achievements, especially the income dimension.
Through employment, quality education can
translate into higher and better-distributed incomes.
Decent work, income levels and distribution, and economic
complexity correlate with each other. It is not surprising
to see poor correlations between the unemployment rate
and both the inequality-adjusted income challenge index
and the vulnerable employment indicator. This contrasts with a strong correlation between
the vulnerable employment indicator and the inequalityadjusted
income challenge index (figure 7).
Education is among the most important aspects of
gender inequality. While the gender gap has improved
globally in the last few years, it is still prominent,
especially for poorer and more challenged countries.
Most countries still achieve fewer years of schooling
for women than for men (figure 8). This gender gap
is widest for countries with an average of less than
10 years of schooling, with a few exceptions such as
Kuwait, Lesotho and Libya.
Globally, on average, women’s GNI per capita is $10,000
less than that of men ($24,458 for men compared with
$14,441 for women). In average monthly wages, a
woman in informal employment earns only 47 per cent of
what a man in formal employment earns. Women in the
formal sector earn only 79 per cent of what men in formal
employment earn.

What makes some countries perform better on drivers of
human development achievements? In short, they have
good governance and institutional effectiveness, which
equips them to create requisite policies and make them
work.
Top performers on governance are generally
also among the top performers on development, shown in
the positive correlation between the governance challenge
index and the quality-adjusted human development challenge
index (figure 9).
On the environmental sustainability index, most regions have a higher environmental health challenge than a climate change and energy efficiency challenge (figure 10). The former accounts for around 80 per cent of the environmental sustainability challenge in South Asia. The only two regions with a higher climate change and energy efficiency share are Europe and Central Asia and North America. In the latter, three quarters of its score comes from this dimension.
Governance influences environmental sustainability but the relationship is not straightforward. Overall, the governance challenge index seems to have a positive correlation with the environmental sustainability index. Governance seems to affect each component of the environmental sustainability index differently, however. It is negatively correlated with climate change, highlighting the fact that some of the richer countries with better governance systems, like Canada, Luxembourg, Singapore and the United States, are also among the world’s biggest emitters of greenhouse gases.
Poor governance may be the world’s most pressing development challenge. It has far-reaching consequences affecting all other aspects of human development, particularly those related to economic prosperity and social and political stability. Against this backdrop, the present chapter sets out two key findings. First, governance is the most significant challenge in the DCI and the only component that is on the rise globally. Second, conspicuous regional and subregional gaps exist in key indicators of government effectiveness, particularly in the Arab region.

"Sub-Saharan Africa’s investment in health is particularly low, with expenditure at per cent of GDP in 2018 compared to a world average of per cent."
The largest share of the world’s population lives in countries scoring in the high-challenge group on the governance index, as in 2000 (figure 13). In 2010, the highest number of people was in the mediumchallenge category, prior to a noticeable deterioration through 2020. This trend was mainly driven by an increase in governance challenges in some Sub- Saharan African as well as European and Central Asian countries. The increase from a high to a very high level in some countries between 2000 and 2010, such as Iran and Sri Lanka, led to more people living in countries with very high governance challenges.
Democracy necessitates guaranteeing fundamental rights and freedoms to function properly. Moreover, laws and institutions are needed to protect human rights and freedoms. For this reason, human rights and good institutions tend to go hand in hand. Not surprisingly, there is a strong correlation between the governance challenge index and human rights and freedoms indicators, such as the simple average of the harassment of journalists and government censorship of the media, and the simple average of freedom from political killings and from torture (figure 14).
A lack of human rights and freedoms prevents people from enjoying a decent life as do gaps in essential public services. Both can be major drivers of violence and conflict, which explains the strong correlation between the governance challenge index and the Global Peace Index produced by the Institute for Economics and Peace (figure 15). The peace index includes 23 quantitative and qualitative indicators on the level of societal safety and security, the extent of ongoing domestic and international conflict, and the degree of militarization. The strong correlation is a result of the association of the index with both democracy and effectiveness.
Governance is the world’s most pressing development challenge
Environmental sustainability is a major concern for both developed and developing countries.
There is still much to be achieved, especially on the quality of human development, even in the richest regions.
Strengthen environmental and
health systems to improve
healthy life outcomes
Build knowledge-based
economies with integrated
education and labour
market systems to harness
opportunities and minimize the
negative impacts of the Fourth
Industrial Revolution
Forge strong links between
government effectiveness
and democratic governance

Prioritize the most challenged
countries and ensure human
security in conflict-stricken
countries